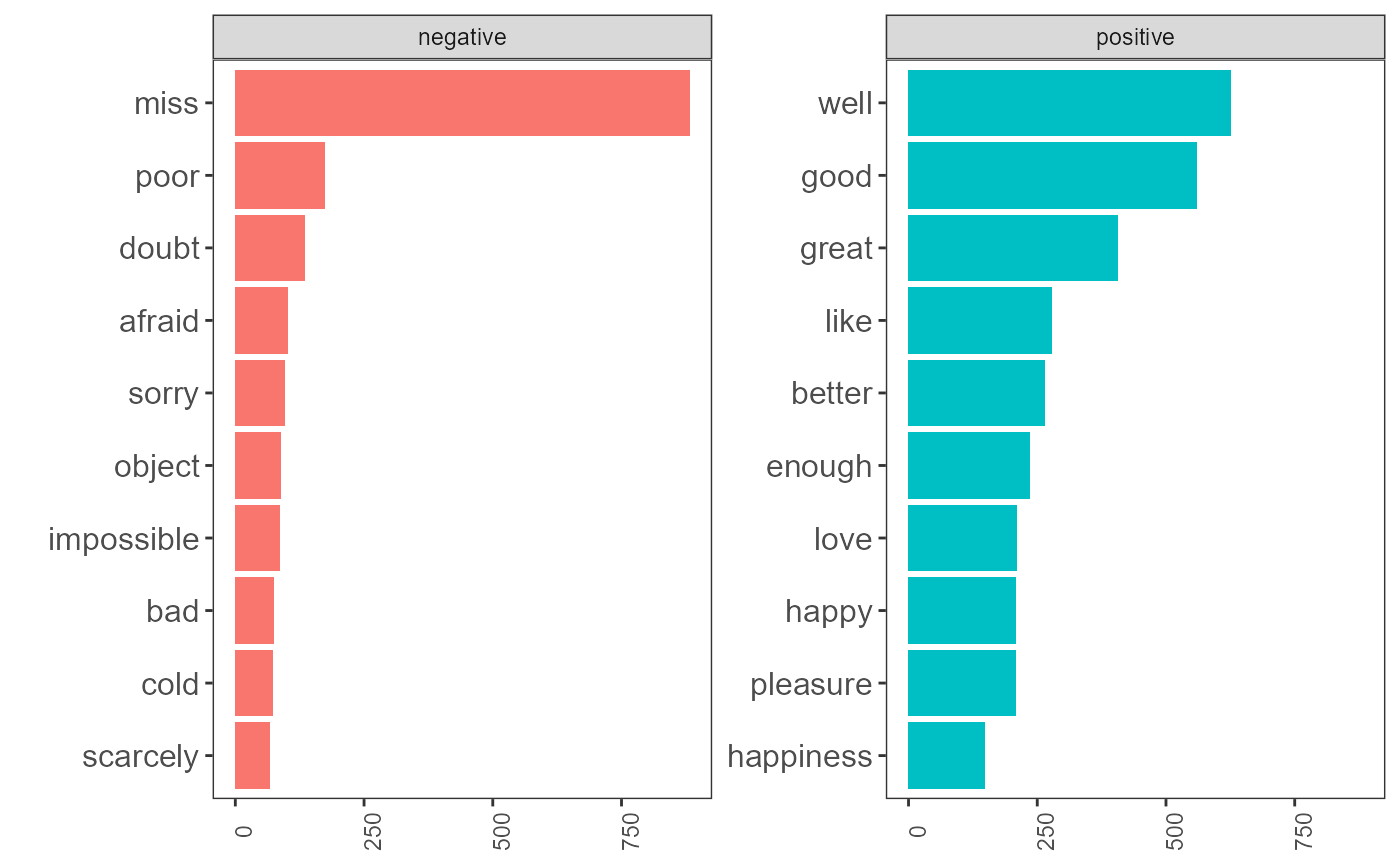
Plot bar plots of the most frequent words.
plot_bing_word_counts.RdPlot bar plots of the most frequent words.
plot_bing_word_counts(bing_word_counts)
Arguments
| bing_word_counts | A data frame from |
|---|
Value
A ggplot (ggplot::geom_col).
Examples
library(experienceAnalysis) books <- janeaustenr::austen_books() # Jane Austen books emma <- paste(books[books$book == "Emma", ], collapse = " ") # String with whole book pp <- paste(books[books$book == "Pride & Prejudice", ], collapse = " ") # String with whole book # Make data frame with books Emma and Pride & Prejudice x <- data.frame( text = c(emma, pp), book = c("Emma", "Pride & Prejudice") ) # Word counts for both books calc_bing_word_counts(x, target_col_name = "book", text_col_name = "text", filter_class = NULL) %>% plot_bing_word_counts()#>
