The pipeline consists of two distinct modules:
- A text classification pipeline for classifying patient feedback text into themes like Communication, Environment/facilities, Staff, etc.
- A text mining dashboard reporting results from text classification, sentiment analysis, and analysis of word frequencies to surface information about what patients most talk about, what frustrates them, what they most like in the service etc.
For the scope and more high-level descriptions of the different analyses carried out see this blog post and project description.
In terms of the nitty gritty, we are particularly excited about having combined super-cool packages in R and Python to build the pipeline! Two highlights of our work are the use of what we consider to be game-changer R packages:
{golem}- “[…] an opinionated framework for building production-grade shiny applications”. Package{golem}automatically provides the structure for the{shiny}skeleton (app & ui) and makes it very easy to build Shiny apps that are modular, strict as to where the business logic goes, documented, tested, shareable, and agnostic to deployment.{reticulate}- an R interface to Python that opened up for us unique opportunities for using state-of-the-art Python packages for text classification and sentiment analysis directly in R.
For more details, refer to this presentation where I describe both packages in much enthusiasm!
Pipeline overview
Let’s take a look at the whole pipeline:
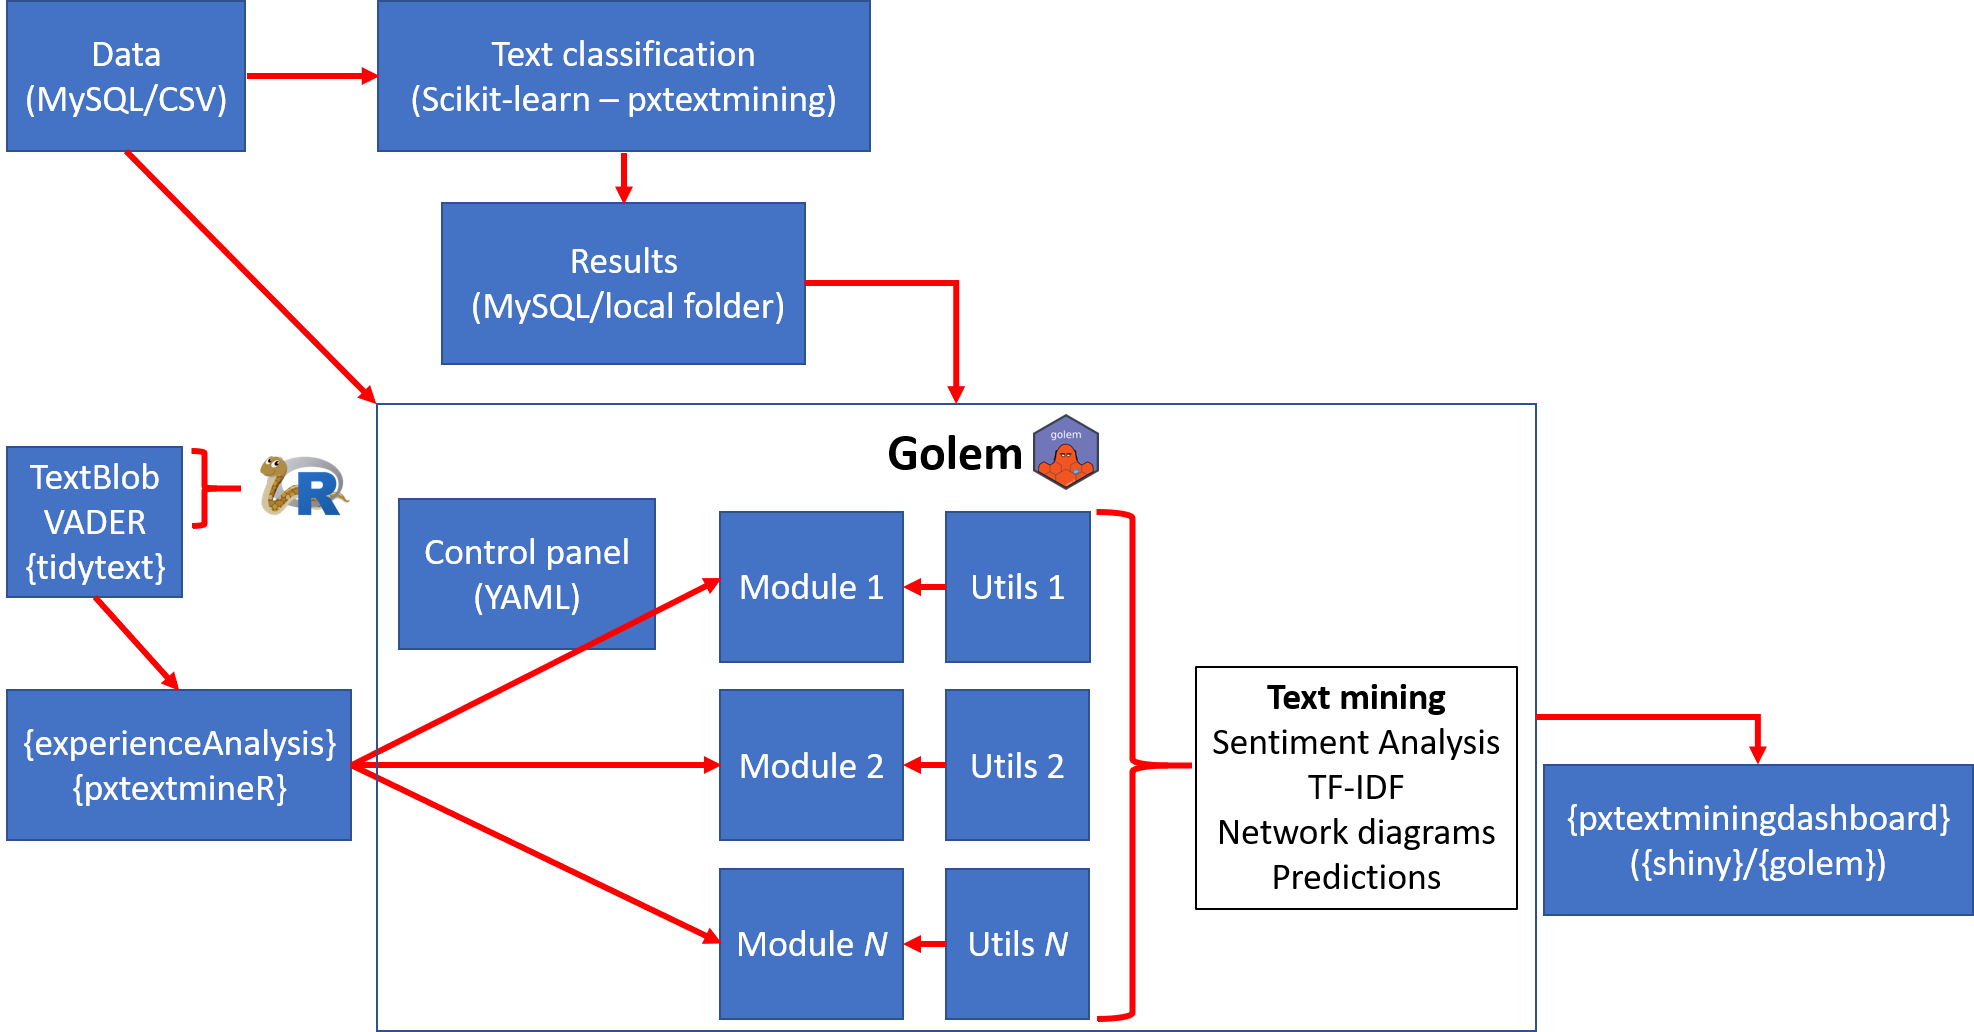
The pipeline consists of an ecosystem of tailor-made packages in R ({experienceAnalysis}, {pxtextmineR}, {pxtextminingdashboard}) and Python (pxtextmining) that we designed to be both fit-for-purpose, but also as generic as possible for use by other NHS trusts or by anyone in general. Let’s break down the pipeline into smaller steps:
- The pipeline reads the text data and sends it to the text classification pipeline, as well as to the dashboard.
- The text classification pipeline uses
Scikit-learn- fuelledpxtextminingto tune and train a Machine Learning model. It then writes the results (predictions, performance metrics, classifier performance bar plots, a SAV with the trained text classification pipeline etc.). These are then passed into dedicated modules in the{golem}dashboard that present predictions on unlabelled feedback, as well as tables and plots with performance metrics. - Meanwhile, the text data is also passed into the dashboard for sentiment analysis and other text mining (e.g. TF-IDFs). The dashboard has dedicated modules that use our external packages to perform these analyses. In particular,
{experienceAnalysis}makes extensive use of{tidytext}, although it offers functions that conveniently perform automatically a few data preprocessing and manipulation steps that would otherwise need to be done manually before passing them to the{tidytext}functions. On the other hand,{pxtextmineR}has{reticulate}- fuelled functions for doing sentiment analysis with Python packagesTextBlobandvaderSentiment. - Internally, the
{golem}dashboard also has a series of R scripts containing simple utility functions that are useful for running small tasks (e.g. sort a character vector) that would otherwise be run inside the modules themselves. - Note that using external packages and utility functions to prepare the data keeps the modules clean from any business logic that would make the dashboard too specific to the dataset used. This is a key advantage of
{golem}: we can use the dashboard as a framework for reporting results on any dataset that we would like to use! A simple example is the following: say we want to report averages for a number of categories. This could be mean sepal length for each plant species in theirisdata, mean flipper length for each penguin species in thepenguindata, and mean miles per gallon for each car engine type in themtcarsdata. We can build a{golem}that produces the mean of a variable according to different categories and then pass eitheriris,penguinormtcarsto get a dashboard for each of these datasets. - And this is exactly where the YAML file in
{golem}comes in handy. The YAML file acts as a control panel where the user specifies what dataset and which columns from the dataset to use in the business logic. In our case, this means that we can produce a dashboard for our own data or for the patient feedback data of any NHS trust! As deployment with{golem}is pretty straightforward, we are able to host several dashboards on the server, each of which uses a dataset from a different NHS trust. - Amazingly,
{golem}ships the whole dashboard as an R package! We call our packaged dashboardpxtextminingdashboard. This package contains open patient experience data in RDA format that can be used to run the app. All you need to do is installpxtextminingdashboard, load it in R and runrun_app. The dashboard is also available here.
Conclusion
We have built a truly revolutionary text mining pipeline that can be used for free by any NHS trust and will hopefully help surface business-critical information to guide improvements in healthcare services. We believe that the pipeline is a great example of how one can make the best of both R and Python. Both {golem} and {reticulate} are game-changers- try them out!